

T20 World Cup 2026: A numerical breakdown of Wankhede Stadium — top batters, leading bowlers, best partnerships, and how the pitch behaved.

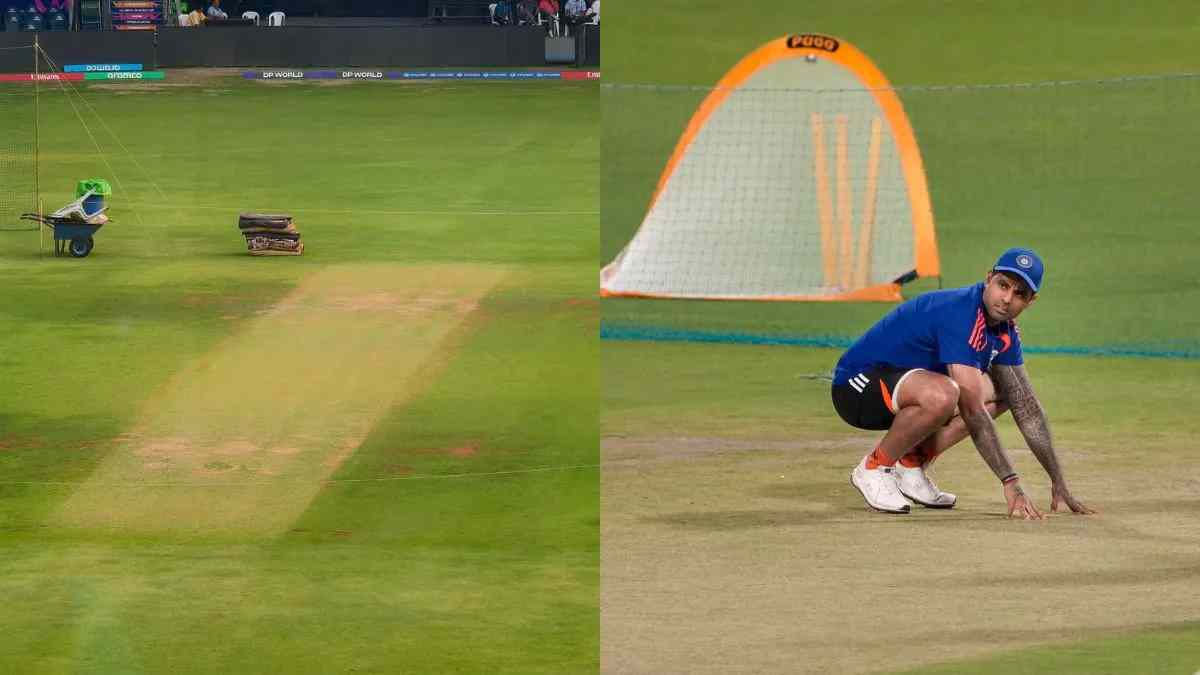
Between the start of 2016 and the lead-up to the ICC Men’s T20 World Cup 2026, the Wankhede Stadium in Mumbai hosted eight T20Is with an impressive run rate of 9.58. A batting average of 29.75 across a total of 2,946 runs highlighted how comfortable batters have traditionally been at the venue. However, the ongoing World Cup has presented a different challenge, with the surface proving far less friendly for batters.
In the 2026 T20 World Cup so far, the run rate at Wankhede has dropped to 8.63, with the batting average falling to 25 across seven matches. Despite the more balanced conditions, the highest total recorded at the venue during this tournament remains 254, set ahead of India’s semifinal clash against England.
Meanwhile, the teams have breached the 170-run mark on six occasions at the venue during the tournament. Only the United States of America (USA) remain the only side that failed to reach a run rate of eight runs per over at least once at Wankhede during the 2026 T20 World Cup.
England enjoy blistering batting in Mumbai during T20 WC 2026
The batters have celebrated 12 half-centuries in the ongoing ICC event at this venue, with the highest individual score being 85. The pitches have been the same as the bilateral series, with the batters struggling to get full value for their shots.
| Inns | 113 |
| Runs | 2169 |
| HS | 85 |
| Ave | 23.83 |
| SR | 136.93 |
| 50s | 12 |
| 100s | 00 |
| 4s | 171 |
| 6s | 120 |
Fig 1: Aggregate runs at Wankhede Stadium in T20 WC 2026
Read More: T20 World Cup 2026: Key battles to watch out for in India vs England semi-final
Shimron Hetmyer enjoys batting in Mumbai
Nepal’s Dipendra Airee is currently the leading individual run-getter at the Wankhede Stadium. He has bagged 169 runs in four innings at an average of 56.33, thanks to a couple of half-centuries. Subsequently, West Indies’ Shimron Hetmyer has collected 154 runs in this World Cup for a strike rate of 197.43.
| Player | Inns | Runs | SR |
| D Airee (NEP) | 04 | 169 | 144.44 |
| S Hetmyer (WI) | 03 | 154 | 197.43 |
| S Rutherford (WI) | 02 | 107 | 194.54 |
| J Bethell (ENG) | 02 | 88 | 151.72 |
| S Yadav (IND) | 01 | 84 | 171.42 |
Fig 2: Most runs at Wankhede Stadium in T20 WC 2026
Italy brothers’ record partnership
The two Italy brothers, Anthony and Justin Mosca, recorded the highest partnership of 124* runs for the opening wicket at this ground against Nepal for their historic victory. On the other hand, Rovman Powell and Hetmyer added 122 runs for the third wicket at a run rate of 14.07 in just 8.4 overs against Zimbabwe.
| Partners | Wkt | Runs | RR |
| A Mosca & J Mosca (ITA) | 01 | 124* | 9.78 |
| S Hetmyer & R Powell (WI) | 03 | 122 | 14.07 |
| S Hetmyer & S Hope (WI) | 02 | 91* | 9.25 |
| D Airee & R Paudel (NEP) | 03 | 82 | 9.11 |
| M Jones & G Munsey (SCOT) | 01 | 80 | 8.00 |
Fig 3: Best partnerships at Wankhede Stadium in ICC T20 WC 2026
Read More: Brook has employed spin for 72.4 overs in T20 WC 2026 – the most by any England captain at a T20 WC
Teams struggle in middle overs
Only Nepal and West Indies have struggled during the first six overs of the innings at Wankhede Stadium during the T20 WC 2026. And quite surprisingly, both have lost six wickets each in that period. Meanwhile, England have been excellent for a strike rate of 186.11 in the powerplay, besides finding the middle overs (7-15) a hard phase for the strike rate of 127.78.
Once it comes to the last five overs of the T20Is, West Indies have been the most successful team with a strike rate of 224.19. They managed 139 runs in just 62 balls during this phase, losing only four wickets.
| Team | Inns | Runs | SR |
| Nepal | 04 | 164 | 113.89 |
| West Indies | 03 | 129 | 119.44 |
| England | 02 | 121 | 168.06 |
| Italy | 01 | 67 | 186.11 |
| Scotland | 01 | 49 | 136.11 |
Fig 4: Batting breakup in Powerplay (1-6) at Wankhede Stadium in T20 WC 2026
| Team | Inns | Runs | SR |
| West Indies | 03 | 276 | 170.37 |
| Nepal | 04 | 229 | 106.02 |
| England | 02 | 138 | 127.78 |
| Scotland | 01 | 73 | 135.19 |
| United Stats of America | 01 | 65 | 120.37 |
Fig 5: Batting breakup in Middle overs (7-15) at Wankhede Stadium in T20 WC 2026
| Team | Inns | Runs | SR |
| Nepal | 04 | 192 | 169.91 |
| West Indies | 03 | 139 | 224.19 |
| England | 02 | 80 | 148.15 |
| India | 01 | 64 | 213.33 |
| Zimbabwe | 01 | 36 | 225.00 |
Fig 6: Batting breakup in death overs (16-20) at Wankhede Stadium in T20 WC 2026
Spinners enjoy bowling at Wankhede Stadium in T20 WC 2026
The ongoing 20-over tournament has not reflected the traditionally batting-friendly nature of the Wankhede Stadium in Mumbai. Spinners have enjoyed bowling on this surface, claiming 40 wickets in 37 innings at an economy rate of 8.01. Pacers, meanwhile, have taken 43 wickets in 41 innings, though at a higher economy rate of 9.10.
Overall, 85 wickets have fallen at the venue during the T20 World Cup 2026, at a bowling strike rate of 18.60. The combined economy rate stands at 8.48, with bowlers also registering three four-wicket hauls during the tournament.
| Inns | 82 |
| Wkts | 85 |
| Ave | 26.30 |
| Eco | 8.48 |
| SR | 18.60 |
| 4W | 03 |
| 5W | 00 |
| BBI | 4/25 |
Fig 7: Aggregate wickets at Wankhede Stadium in T20 WC 2026
Read More: T20 WC 2026: Will Samson overcome the short/hard length conundrum against England in Wankhede SF?
Gudakesh Motie enjoys Mumbai surface
Three West Indies bowlers feature among the leading wicket-takers at the Wankhede Stadium in the tournament. Left-arm spinner Gudakesh Motie tops the list with seven wickets in three innings at an impressive strike rate of 8.50. Meanwhile, Akeal Hosein has also made a strong impact, claiming five wickets at an excellent strike rate of 7.50.
| Player | Inns | Wkt | SR |
| G Motie (WI) | 03 | 07 | 8.50 |
| J Holder (WI) | 03 | 05 | 10.8 |
| A Hosein (WI) | 03 | 05 | 7.50 |
| N Yadav (NEP) | 04 | 05 | 8.63 |
| SC van Schalkwyk (USA) | 01 | 04 | 6.25 |
Fig 8: Most wickets at Wankhede Stadium in T20 WC 2026
England struggle in middle overs’ bowling
Most teams have done well in the first six overs with the ball at the Wankhede Stadium. England, in particular, have picked up five wickets at a strike rate of 14.40. However, they have struggled in the middle overs (7–15), managing only three wickets at a bowling strike rate of 36. In the death overs (16–20), no team has recorded a bowling strike rate above 10 apart from England.
| Team | Inns | Wkts | SR |
| West Indies | 03 | 07 | 15.43 |
| England | 02 | 05 | 14.40 |
| United States of America | 01 | 04 | 09.00 |
| India | 01 | 03 | 12.00 |
| Nepal | 04 | 03 | 48.00 |
Fig 9: Bowling breakup in Powerplay (1-6) at Wankhede Stadium in T20 WC 2026
| Team | Inns | Wkts | SR |
| West Indies | 03 | 14 | 11.57 |
| Italy | 01 | 04 | 13.50 |
| England | 02 | 03 | 36.00 |
| Nepal | 04 | 03 | 67.33 |
| Scotland | 01 | 03 | 18.00 |
Fig 10: Bowling breakup in middle overs (7-15) at Wankhede Stadium in T20 WC 2026
| Team | Inns | Wkts | SR |
| Nepal | 03 | 09 | 6.89 |
| West Indies | 03 | 07 | 10.0 |
| Italy | 01 | 05 | 5.40 |
| England | 02 | 04 | 15.0 |
| India | 01 | 04 | 7.50 |
Fig 11: Bowling breakup in death overs (16-20) at Wankhede Stadium in T20 WC 2026
The Harry Brook-led side will be up against the Suryakumar Yadav-led side at this venue in the semifinal on March 05. Both teams have faced each other only twice at this ground, with India winning the most recent encounter in February 2025. However, it all comes down to March 05 and which team handles the pressure better.
Read More: Harry Brook’s epic century, in a chase against Pakistan, one of the best knocks in T20 WC history
