
T20 World Cup 2026: Chepauk hasn’t behaved like a typical turner — a statistical look at why batters have thrived.
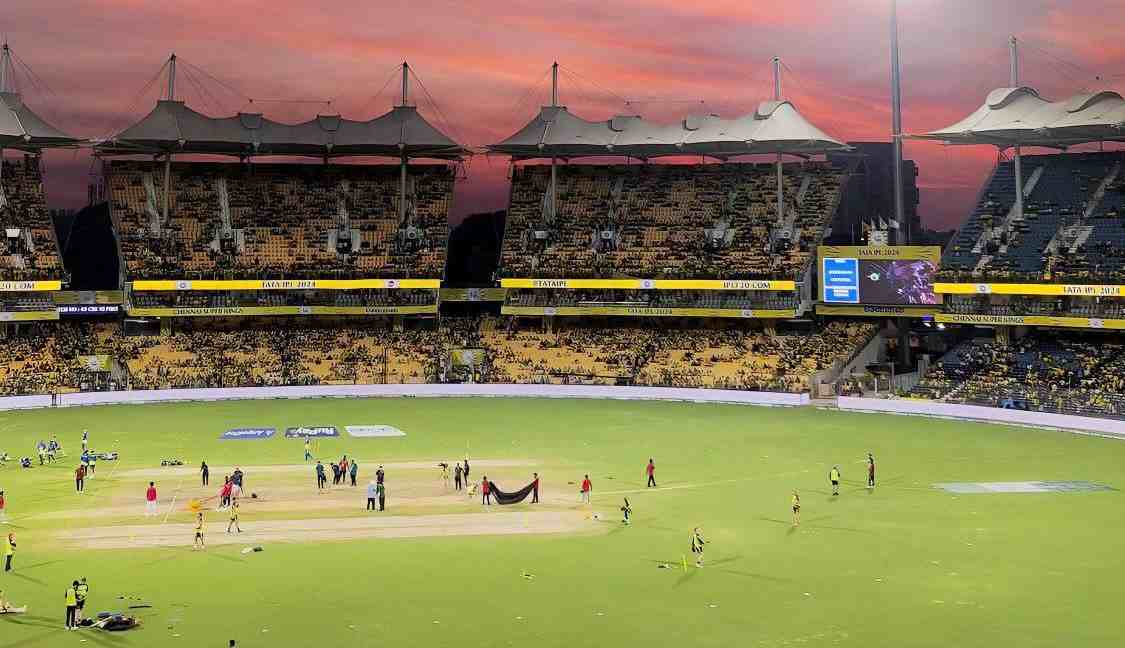
Between the start of 2016 and the beginning of the Men’s T20 World Cup 2026, the MA Chidambaram Stadium in Chennai hosted two T20Is for a run rate of 8.74. The batting average of 28.91 for the aggregate of 694 T20I runs reflects the need for skill with the bat in individuals. But the pendulum has swung in the batters’ favour since the ground underwent a major upgrade ahead of the ongoing competition.
In the ongoing T20 World Cup 2026, the run-rate at this ground has risen to 9.12, with a batting average of 33.54 across six games. The highest score at this venue, ahead of India’s Super 8 clash against Zimbabwe, remains 200. Meanwhile, teams have breached the 170-run mark nine out of 12 times, which is an extraordinary performance.
Apart from Canada and the Netherlands’ innings against Afghanistan and the United States of America (USA), respectively, all the innings have exceeded the run rate of eight at this ground.
Read More: Among Super 8 teams, India have the lowest run rate (6.91) in middle overs (7-15) in T20 WC 2026
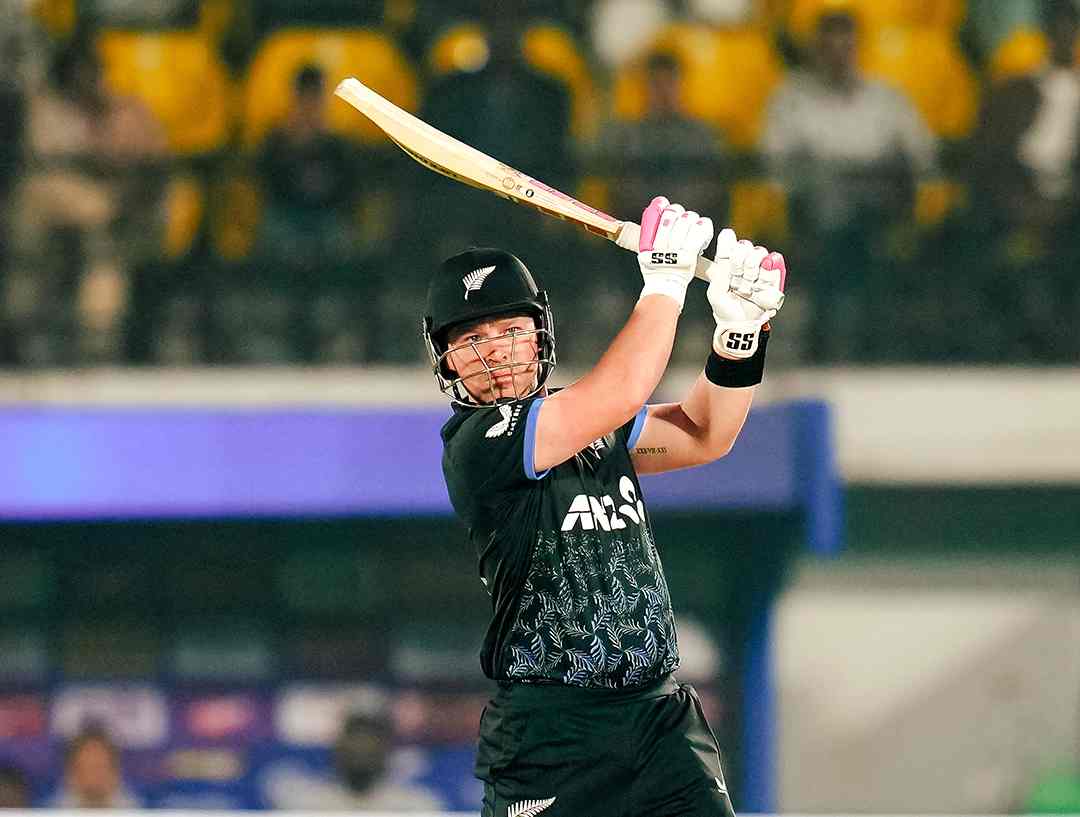
New Zealand enjoy blistering batting in Chennai during T20 WC 2026
The batters have celebrated one century and 13 half-centuries in the ongoing ICC event at this venue for the highest score of 110. This is a massive feat in conditions that were favourable to the spinners throughout the innings. The newly laid outfield has been a massive advantage for the batters in getting full value for their shots.
New Zealand’s opener, Tim Seifert, has enjoyed the conditions the most. He is the leading run-getter at this venue so far with 160 runs in three innings at a strike rate of 170.21 with two half-centuries. Glenn Phillips has a blistering strike rate of 193.44 on this ground.
Seifert has nailed the most boundaries (20) in this event at the venue. Subsequently, Philips has smashed the most sixes (07) in the same qualification.
Most runs in Chepauk during ICC T20 WC 2026
| Name | Inns | Runs | SR | 4s/6s | 50s/100s | HS |
| T Seifert (NZ) | 03 | 160 | 170.21 | 20/06 | 02/00 | 89* |
| Y Samra (CAN) | 02 | 127 | 160.75 | 14/06 | 00/01 | 110 |
| G Phillips (NZ) | 03 | 118 | 193.44 | 11/07 | 01/00 | 76* |
| F Allen (NZ) | 03 | 106 | 176.66 | 07/06 | 01/00 | 84* |
| I Zadran (AFG) | 02 | 105 | 154.41 | 08/05 | 01/00 | 95* |
In terms of batting partnerships, Finn Allen and Seifert’s unbeaten opening stand of 175 runs sits at the top of the list. A total of four centuries have been recorded at this venue in the ongoing World Cup 2026.
Read More: West Indies batters pack a punch against Zimbabwe; register second-highest total in T20 WC history
Best partnerships in Chepauk during ICC T20 WC 2026
| Partners | Wkt | Runs | RR | Opposition |
| F Allen & T Seifert (NZ) | 01 | 175* | 11.41 | UAE |
| G Phillips & R Ravindra (NZ) | 03 | 146* | 12.16 | Canada |
| D Bajwa & Y Samra (CAN) | 01 | 116 | 8.28 | New Zealand |
| M Waseem & A Sharafu (UAE) | 02 | 107 | 8.33 | New Zealand |
| I Zadran & S Atal (AFG) | 03 | 95 | 9.66 | Canada |
Apart from New Zealand’s powerplay strike rate of 166.67 and the United States of America’s 155.56, most teams have struggled in the powerplay overs. But because New Zealand lost only four wickets inside the first six overs in three innings, they had options to go at a strike rate of 179.63 in the middle overs (7-15).
In the death over (16-20), Afghanistan have been phenomenal for the strike rate of 179.63, losing only two wickets in three innings.
Batting performance in Powerplay (1-6) in Chepauk in T20 WC 2026
| Team | Inns | Runs | Outs | SR | 4s/6s |
| New Zealand | 03 | 180 | 04 | 166.67 | 23/07 |
| USA | 02 | 112 | 01 | 155.56 | 08/07 |
| Afghanistan | 02 | 86 | 04 | 119.44 | 10/01 |
| Canada | 02 | 82 | 03 | 113.89 | 11/03 |
| Namibia | 01 | 53 | 01 | 147.22 | 04/03 |
| Netherlands | 01 | 44 | 03 | 122.22 | 03/01 |
| UAE | 01 | 41 | 01 | 113.89 | 05/01 |
Batting performance in middle overs (7-15) in Chepauk in T20 WC 2026
| Team | Inns | Runs | Outs | SR | 4s/6s |
| New Zealand | 03 | 291 | 02 | 179.63 | 21/15 |
| Afghanistan | 02 | 164 | 01 | 151.85 | 10/07 |
| USA | 02 | 163 | 05 | 150.93 | 10/07 |
| Canada | 02 | 137 | 03 | 126.85 | 12/06 |
| UAE | 01 | 71 | 01 | 131.48 | 05/03 |
| Namibia | 01 | 68 | 03 | 125.93 | 06/01 |
| Netherlands | 01 | 49 | 06 | 90.74 | 02/01 |
Batting performance in death overs (16-20) in Chepauk in T20 WC 2026
| Team | Inns | Runs | Outs | SR | 4s/6s |
| Afghanistan | 02 | 110 | 05 | 183.33 | 03/09 |
| USA | 02 | 106 | 04 | 176.67 | 07/06 |
| Canada | 02 | 62 | 06 | 103.33 | 03/04 |
| UAE | 01 | 47 | 04 | 156.67 | 03/03 |
| Namibia | 01 | 42 | 02 | 140.00 | 03/01 |
| New Zealand | 03 | 42 | 01 | 210.00 | 03/03 |
| Netherlands | 01 | 02 | 01 | 40.00 | 00/00 |
Pacers struggle in Chepauk for economy rate of 9.67 during T20 WC 2026
In seven games at the MA Chidambaram Stadium during the T20 World Cup 2026, a total of 61 wickets have fallen. Among these, the spinners have taken 26 wickets in 34 innings, averaging 30.03. They also have carried a decent economy rate of 8.13 for two four-wicket hauls.
Meanwhile, the pacers have bagged 33 wickets in 40 innings at an average of 37.27. They have experienced a very expensive economy rate of 9.67 at a strike rate of 23.1.
New Zealand’s off-spinner, Mohammad Nabi, and USA pacer, Shadley van Schalkwyk, are the highest wicket-takers of the event at this venue with five wickets. USA’s left-arm spinner, Harmeet Singh, has a stunning economy rate of 6.57 in two innings.
Most wickets in Chepauk during T20 WC 2026
| Player | Inns | Wkts | Econ | SR | BBI |
| M Nabi (NZ) | 02 | 05 | 5.00 | 6.00 | 4/7 |
| S van Schalkwyk (USA) | 02 | 05 | 7.46 | 8.20 | 3/21 |
| H Singh (USA) | 02 | 04 | 6.57 | 10.50 | 4/21 |
| M Henry (NZ) | 03 | 04 | 7.66 | 18.00 | 2/37 |
| B de Leede (NED) | 01 | 03 | 9.25 | 08.00 | 3/37 |
In the powerplay, only Afghanistan have maintained a fine economy rate of 7.17 at this ground. They also have a phenomenal strike rate of 14.40. In terms of the middle overs’ bowling, USA have done well for an economy rate of 6.56 for their nine wickets in two innings.
Once it comes to death overs (16-20), the Blackcaps have picked up the most wickets (10) for a strike rate of only nine.
Bowling performance in PP (1-6) in Chepauk in T20 WC 2026
| Team | Inns | Wkts | Econ | SR | BBI | 4s/6s |
| AFG | 02 | 05 | 7.17 | 14.40 | 3/33 | 12/03 |
| Canada | 02 | 04 | 9.08 | 18.00 | 2/47 | 12/02 |
| USA | 02 | 04 | 9.00 | 18.00 | 3/51 | 07/04 |
| New Zealand | 03 | 03 | 8.00 | 36.00 | 2/42 | 16/03 |
| NED | 01 | 01 | 8.83 | 36.00 | 1/49 | 04/03 |
| Namibia | 01 | 00 | 10.83 | ——- | 0/64 | 04/04 |
| UAE | 01 | 00 | 13.00 | ——– | 0/78 | 09/04 |
Bowling performance in middle overs (7-15) in Chepauk in T20 WC 2026
| Team | Inns | Wkts | Econ | SR | BBI | 4s/6s |
| USA | 02 | 09 | 6.56 | 12.00 | 6/50 | 08/02 |
| Afghanistan | 02 | 04 | 9.22 | 27.00 | 2/67 | 16/06 |
| Namibia | 01 | 03 | 7.89 | 18.00 | 3/69 | 04/03 |
| New Zealand | 03 | 03 | 8.56 | 54.00 | 1/71 | 14/10 |
| Netherlands | 01 | 02 | 10.56 | 27.00 | 2/95 | 06/04 |
| Canada | 02 | 00 | 10.61 | —— | 0/82 | 10/12 |
| UAE | 01 | 00 | 10.00 | ——- | 0/90 | 08/03 |
Bowling performance in death overs (16-20) in Chepauk in T20 WC 2026
| Team | Inns | Wkts | Econ | SR | BBI | 4s/6s |
| New Zealand | 03 | 10 | 10.20 | 9.00 | 4/51 | 07/11 |
| Afghanistan | 02 | 04 | 6.26 | 11.75 | 3/13 | 02/03 |
| Netherlands | 01 | 03 | 9.60 | 10.00 | 3/48 | 02/02 |
| USA | 02 | 03 | 7.71 | 11.67 | 2/43 | 03/01 |
| Canada | 02 | 02 | 14.71 | 15.50 | 2/64 | 03/04 |
| Namibia | 01 | 01 | 12.60 | 30.00 | 1/63 | 05/04 |
| UAE | 01 | 00 | 21.00 | ——- | 0/7 | 00/01 |
The MA Chidambaram Stadium in Chennai will host its final game of the T20 WC 2026 on February 26. All eyes will be on that marquee do-or-die encounter. India’s potential qualification for the semifinals is on the line against Zimbabwe. And they will be up against the unfamiliar conditions in Chepauk. The question remains how fast they could adapt to the situation.
Read More: T20 World Cup 2026: Architects of Zimbabwe’s win over Australia
